Powerpop Analytics - Billing
The Billing section in Analytics provides an overview of all tracked billing-related events and conversions. This helps you monitor event activity, conversion performance, and the distribution of events by type over time.
Total Events
- Definition: Shows the total number of billing-related events recorded within the selected timeframe.
- Usage: Helps measure the overall volume of tracked events.
- Example: 93M events as of 2025-08-20.

Total Events Trendline
This chart shows the overall number of tracked events over time (e.g., clicks, views, cart updates). The trendline highlights the general direction of activity, making it easier to spot long-term patterns rather than focusing only on daily fluctuations.
Example:
On 2025-08-15, the metric
SUM(events_count) = 1.44M means there were 1.44 million total events recorded on that day.
The trendline smooths out these values to show whether user activity is generally increasing, decreasing, or staying consistent.

Events by Day
Definition: Displays the daily breakdown of all events over time.
Event Types Included:
onOpen– Event triggered when billing session starts.R– Response or system-related event.onIdle– Triggered when session is idle.onFinish– Marks billing process completion.onFailure– Indicates errors or failures.onConversion– Successful conversions.
- Usage: Allows trend monitoring to see when peaks in activity occur.

Below the chart, you can see a time range selector (the highlighted blue area with handles on both sides).
- You can drag the white handles left or right to decrease or increase the time scope shown in the main chart.
- This allows you to zoom in on specific time periods or zoom out for a broader view.

All and Inv Button

- All → shows every event for that day.
- Inv → shows only the important customer interactions (like clicks, purchases, or cart actions).
Below the filter, you will find two icons that let you adjust the chart view:

- Zoom Area – Click and drag to zoom in on a specific part of the chart for a closer look at the data.
- Restore Zoom – Resets the chart back to its original view.
These tools make it easier to analyze trends in detail while still allowing you to return quickly to the full timeline.
Billing Events by Type
- Definition: Summarizes the total count of events per type.
- Example Data (from screenshot):
- Usage: Helps analyze the frequency of specific event types.
| Event Name | Count |
|---|---|
| onOpen | 733k |
| R | 616k |
| onIdle | 188k |
| onFinish | 2.43k |
| onFailure | 200 |
| onConversion | 104 |
Sum of All Conversions
- Definition: Displays the total number of conversions achieved in the selected period.
- Usage: Key indicator of how many successful conversion actions were completed.
- Example (from screenshot): 2.82k conversions as of 2025-08-17.

Trend Line in Conversions Chart

- The bars show the total number of conversions (events_count) per day.
- The trend line shows the overall direction or pattern over time (whether conversions are going up, steady, or down).
Example:
📅 2025-08-11
- SUM(events_count): 1.69k → means there were 1,690 conversions recorded on this day.
- The trend line point at this date connects with previous and next days, helping you see if conversions are increasing, stable, or dropping.
Conversions by Type
Definition: Shows the breakdown of conversions by conversion type.
Common Conversion Types:
clickLink– Conversion triggered when a user clicks a tracked link.softConversion– Conversions based on less direct interactions.emailSubmitted– Conversions through form or email submission.
- Usage: Helps understand which conversion types are performing best.

Conversions by Day
- Definition: Shows conversions distributed across days within the reporting period.
- Usage: Useful for spotting peaks in conversion activity and linking them to campaigns or changes in billing events.

Acquired New Leads
- Definition: Tracks the number of newly acquired leads through billing-related campaigns.
- Usage: Useful for measuring the growth of potential customers directly generated from billing activities.
- Example: If a customer signs up through a billing-related form, they are counted as a new lead.

Trend Line in New Leads Chart
- The bars show the exact number of new leads gained each day.
- The trend line connects these daily values to show the overall direction or pattern (whether new leads are increasing, stable, or decreasing).
Example:
📅 2025-08-14
- COUNT_DISTINCT(email): 207 → means 207 unique new leads (by email) were acquired on this day.
- The trend line point at this date helps visualize how this number compares to previous and upcoming days.
In short: bars = daily new leads, trend line = big-picture trend over time.
Billing Email List
- Definition: Displays email addresses collected via billing processes or campaigns.
- Usage: Provides a centralized view of emails captured, which can be used for remarketing, retargeting, or customer engagement.

Filters Icon
The Filters icon provides advanced options to refine and customize the data displayed in reports or dashboards. By selecting this icon, you can configure date ranges, event types, and apply or clear filters for precise analysis.

Date
- Default: Current Month

Range Type
- Current – Displays data for the ongoing period (day, week, month, quarter, or year).
- Last – Displays data from the immediately preceding period.
- Previous – Allows selection of earlier past periods.
- Custom – Enables manual selection of start and end dates.
- Advanced – Provides extended options for configuring time ranges.
- No Filter – Removes all date-based filters.

Configure Time Range
When selecting Current, you can further specify the time range:
- Current Day
- Current Week
- Current Month
- Current Quarter
- Current Year

Actual Time Range

Displays the applied time condition. Example:
2025-08-01 ≤ col < 2025-09-01
Event Type
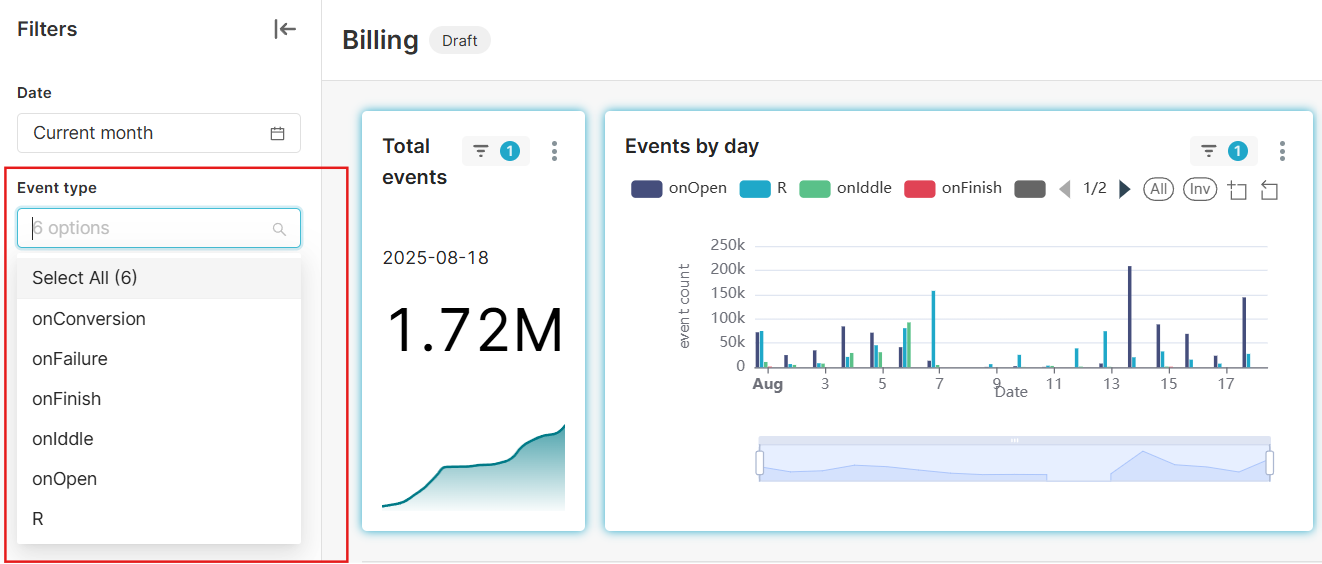
Select specific event types or apply all available options:
- onConversion – Triggered when a user completes the desired goal or action.
- onFailure – Triggered when an attempted action is unsuccessful.
- onFinish – Triggered when a campaign or workflow is completed.
- onIddle – Triggered when no activity is detected within a set period.
- onOpen – Triggered when a campaign or pop-up is opened by a user.
- R – A reserved/custom event type for specific system actions.
Action Buttons
- Cancel – Close the filter settings without applying changes.
- Apply – Confirm and apply the selected filters.
- Clear All – Reset all applied filters to default.

Trend Line Under Each Chart

The trend line under each chart visualizes how the total number of events changes over time.
- Each point on the line corresponds to a specific date.
- Hovering over the line (as in the example) shows the exact date and value (e.g., 2025-08-16 → 1.52M events).
- An upward line means the number of events is increasing.
- A downward line means the number of events is decreasing.
Important:
- Whether an upward or downward trend is good depends on the type of event.
- For example:
- More onOpen or conversions → positive.
- Fewer onFailure events → also positive.
- For example:
This trend line helps you quickly see whether activity is moving in the right direction over time.
With this section, you get a complete overview of billing-related activity: event tracking, conversion monitoring, lead acquisition, and collected email data.
Explore how AI-powered dashboards can give you deeper insights into your performance trends and customer behavior: AI Dashboards